Somewhere Over The Rainbow
A city exploration experience
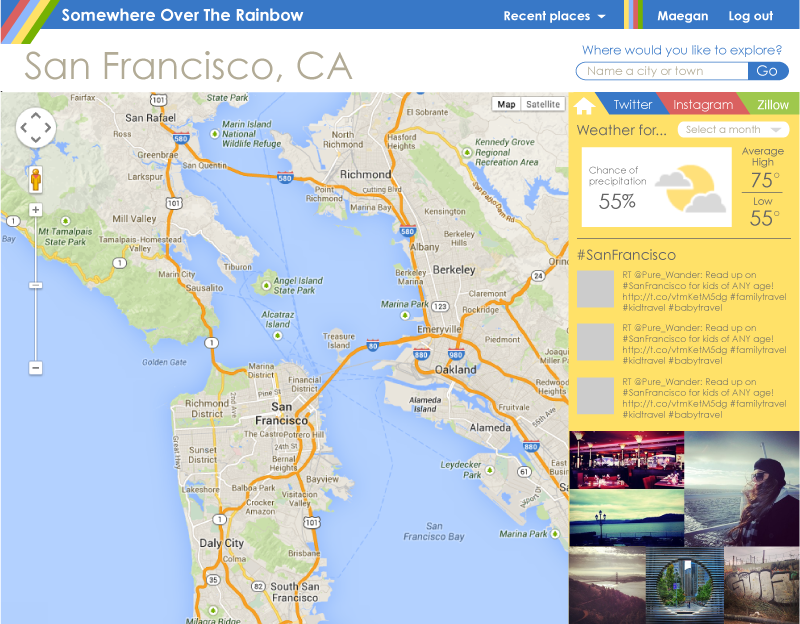
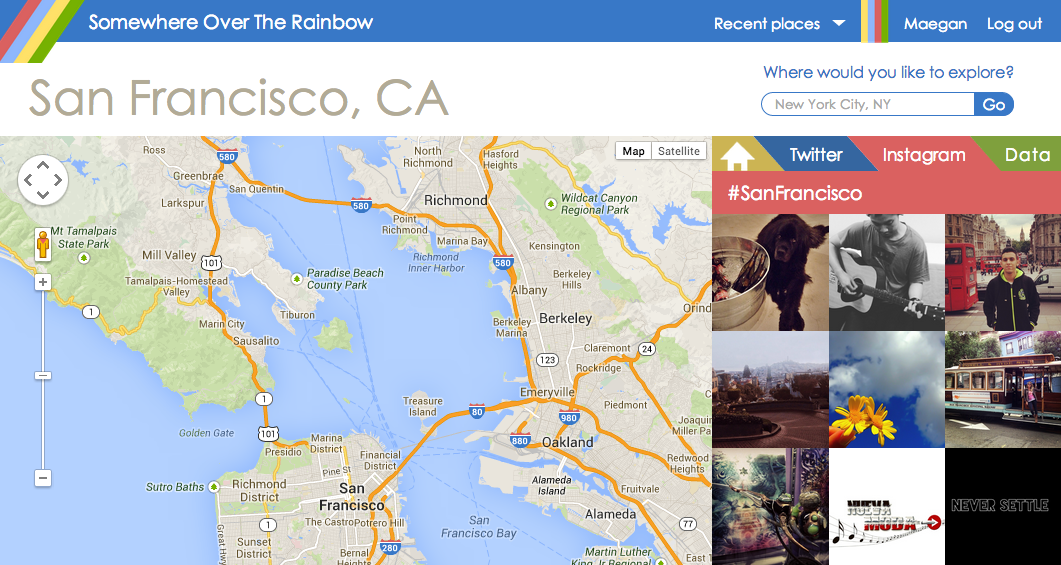
I began this project as an individual entry at HackDuke 2013. It is a web app for people to research places they might want to move to or visit. My main goal was to bring together data from social media and other data resources in a single page to give the user an overall feel for a city without having to search five different sites. You can search for a city and the Google GeoCode API will provide the latitude/longitude of the location to the Google Maps API. The yellow “home” tab features the predicted weather for the selected time of year from the Weather Channel’s API as well as previews of the other tabs. I use the Twitter and Instagram Search APIs to stream posts including the hashtag for the city. The “data” tab loads statistics about the quality of life, cost of living, and demographics of the city from the U.S. Census. Another version of this project allowed users to create accounts on my server and save their favorite searches to track areas of interest.
View the project live
Design Process
I began the project with the concept of a large map filling the screen with the API data in some sort of overlaid container. I explored a variety of designs for organizing the data, such as side tabs, top tabs, separate boxes for each type, etc. I also started out with a much more complex format for searching, but realized I could simplify it all with the GeoCode API. See below for my various iterations from sketching to comp and then visit the current site.
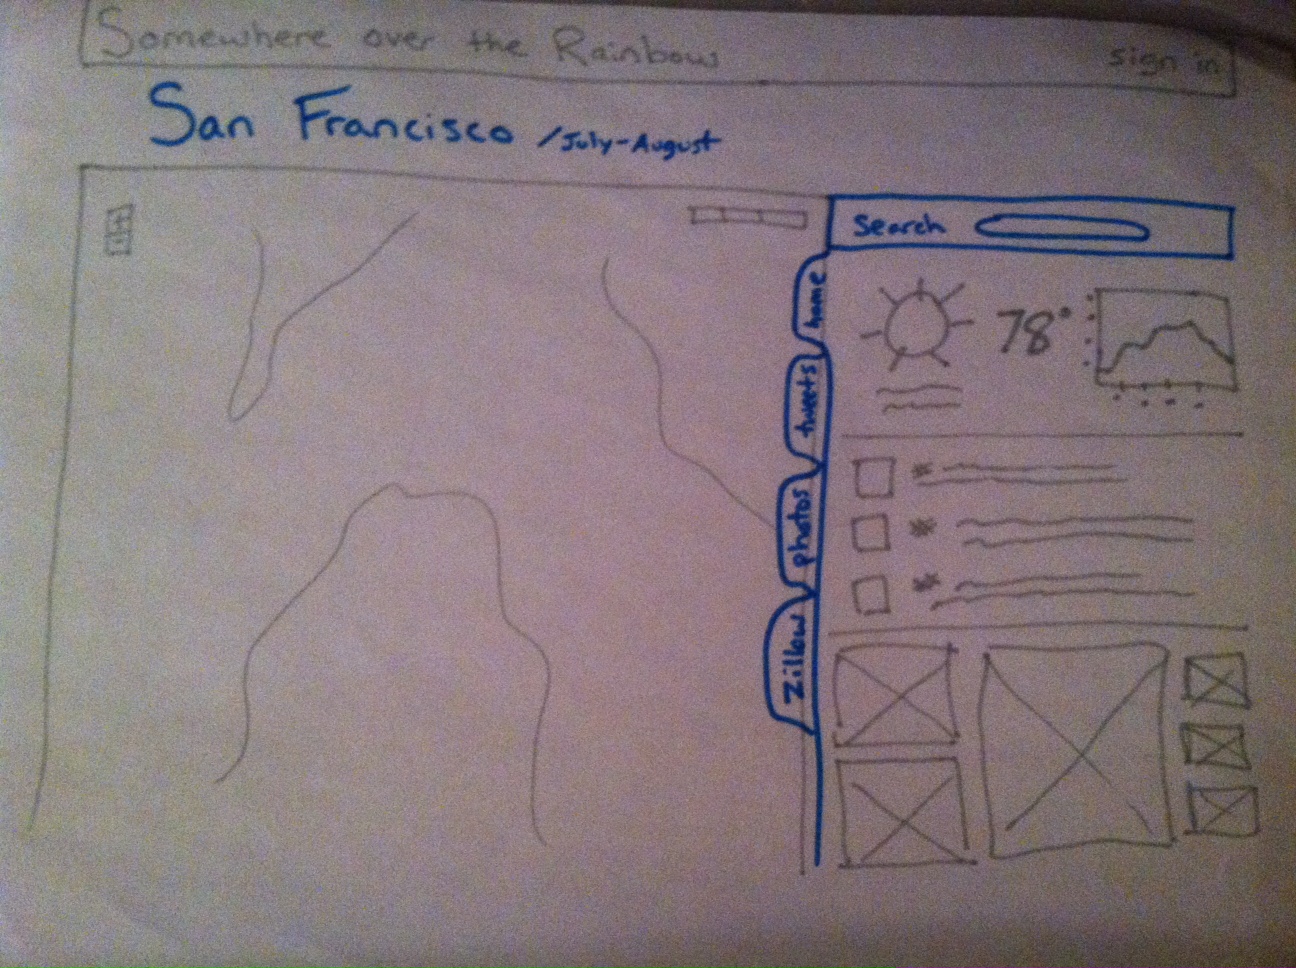
Final Comp
I decided to put the tabs on the top of the data overlay because reading sideways felt like it would be too hard on the reader and didn't necessarily add to the visual appeal of the map. I also liked the name "Somewhere Over The Rainbow" because it lent itself to a lightweight and joyful color scheme that tied the page together. This is the design I made in Adobe Illustrator before I began to code. I used layers to show different states of the page based on different user scenarios.