Making the Grade
An interactive Django project serving and visualizing North Carolina public school data
I worked on this project with a few other students from the UNC Journalism School. It was intended to accompany a videography project depicting the issues swirling around the school-to-prison pipeline in Durham County, NC. After exploring the available data, we realized that focusing only on Durham County high schools would be ethically risky because the data on Durham was not detailed enough to draw specific conclusions. Therefore, we decided to take a step back and compare data across North Carolina school districts. We discovered interesting correlations in respect to demographics, geography, and general trends in K-12 education in the U.S. The project was an incredible opportunity to process and present a large data set that was previously hidden from most citizens.
Scroll down to read more about our development process.
View the project live
Week One - Exploring public data and choosing our focus
We were asked to take on this project four weeks before our sister project would launch. We immediately began researching what data was already available. Our limited time frame made requesting additional public data impossible. Without additional data we were forced to abandon our original idea to focus our visualization project on data about each individual school in Durham. Instead, we discovered a government website with a variety of data about each school district, including academic, socio-economic, and disciplinary information. This seemed like a good focus to us because it would allow us to reveal trends about different areas of the state and correlations between those three types of data.
Week Two - Building our database and wireframing
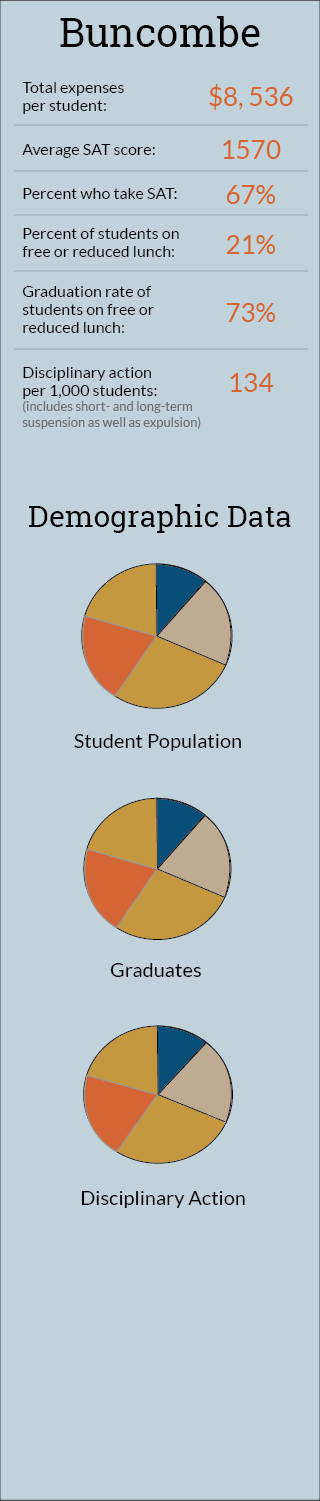
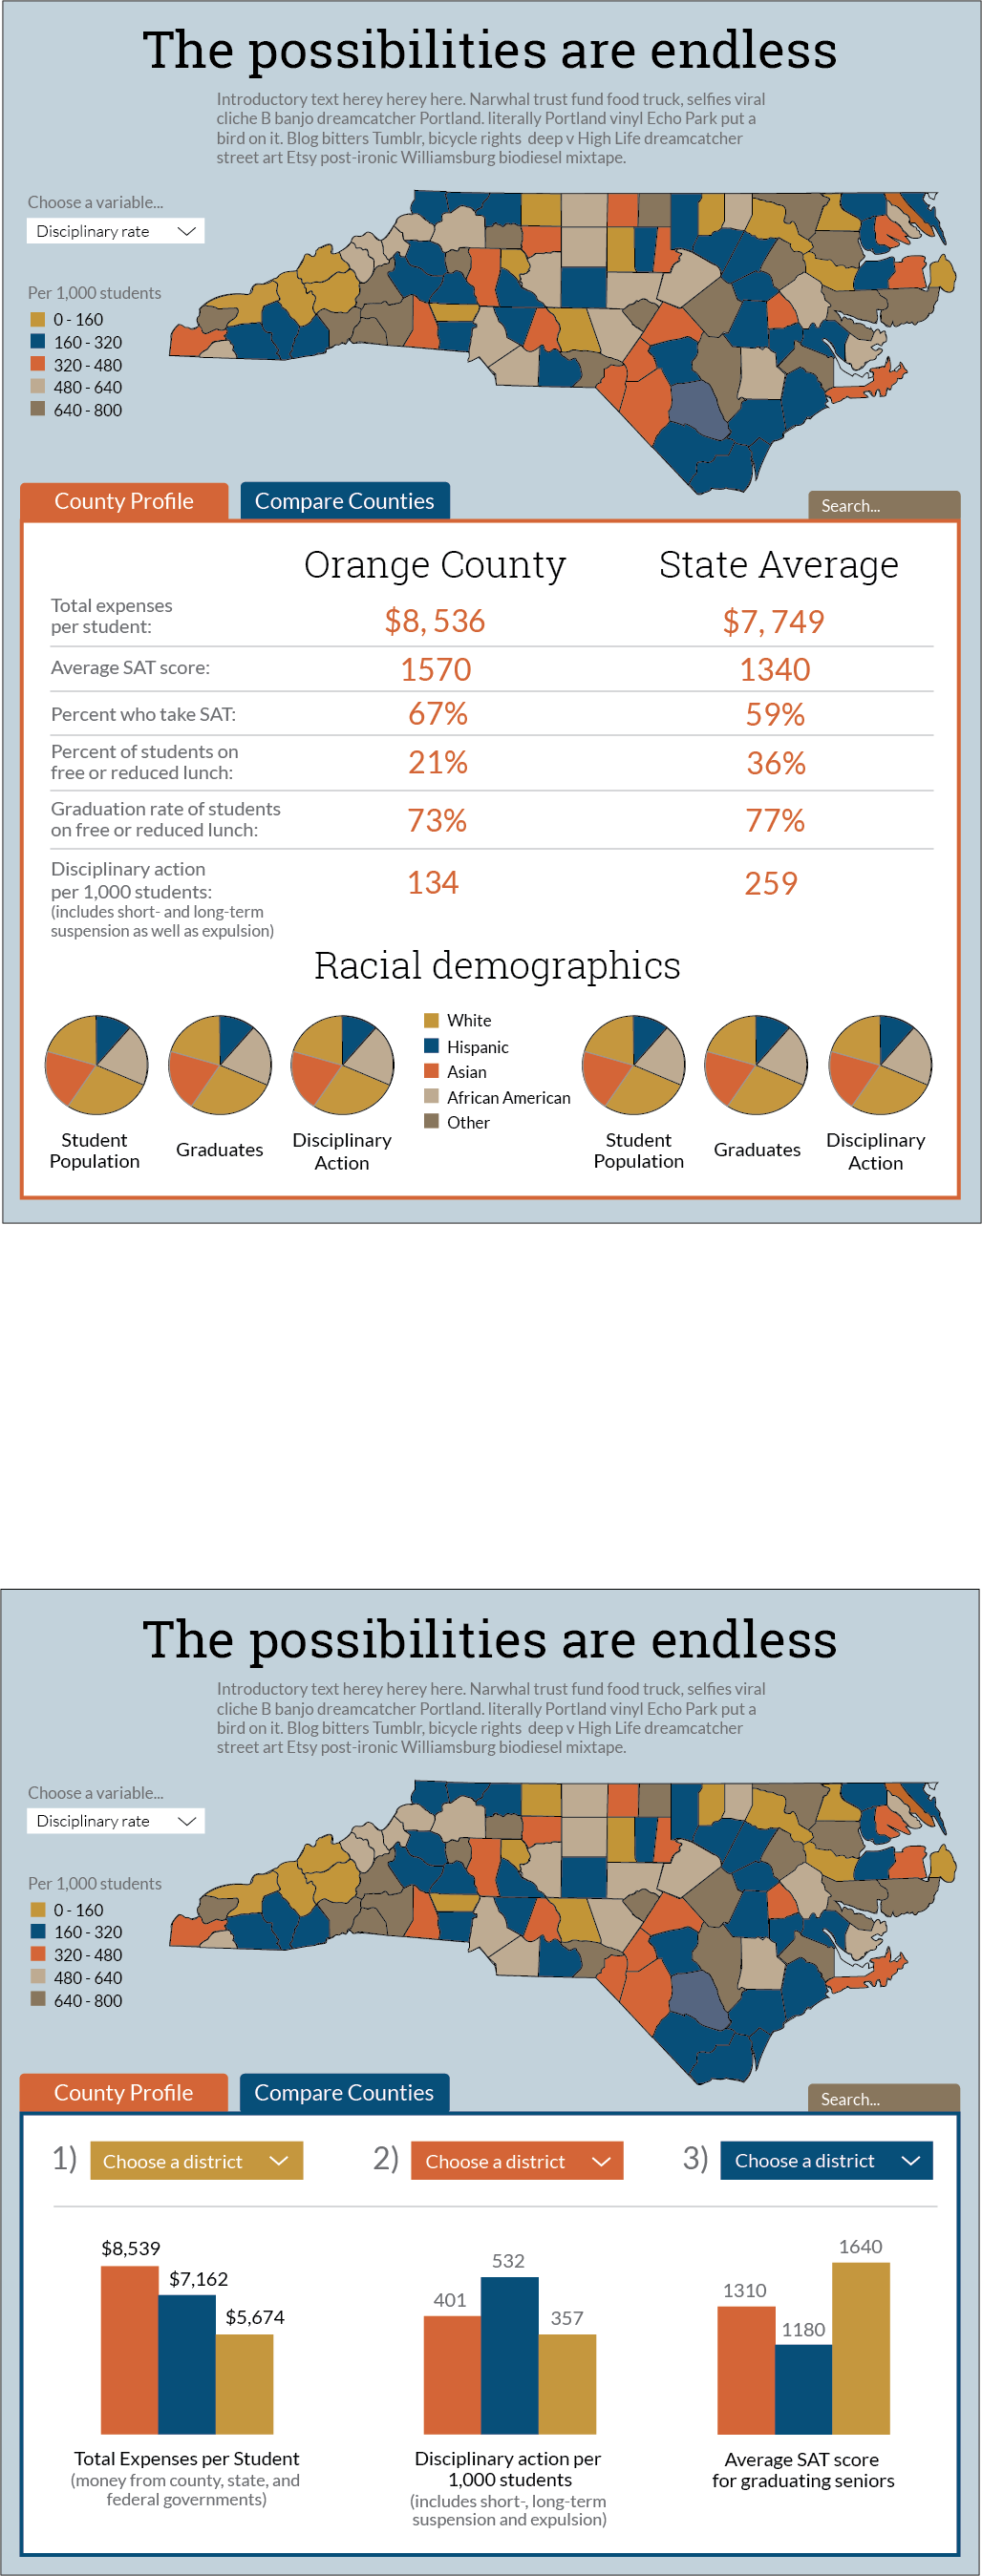
My teammate worked on converting the data from Access to a PostgreSQL database, the ideal tool for the huge amount of data we were processing. Meanwhile, I worked with my other teammate on the design of the site. Our sister project had a predetermined color palette and style guide that we adopted. We had three views of the data that we wanted to visualize - a geographic mapping of trends, a detail profile for a county and a tool for comparing multiple school districts. We felt a single page experience would really enrich the data visualization so we focused on a compact user interface with a powerful user flow. A visitor would 1) explore the map overview, and then 2) click on a district or search to explore the detailed data that was available, then 3) take a look at the differences between the three districts they selected. See below for our color comps:
Week Three - Front-end development... oh, and writing our own API
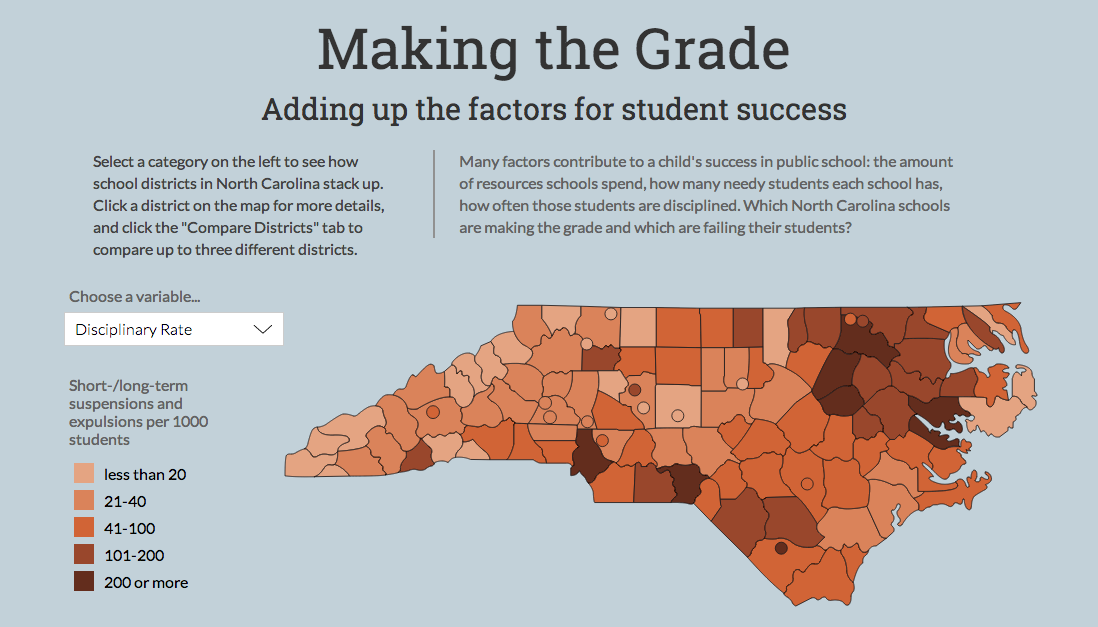
As I began building out the map in code I realized that the coloration of
districts would be more meaningful as shades of the same color since the data
points were relatively continuous. I made the map and bar charts from scratch and used
HighCharts to generate the pie charts dynamically.
I also began to focus on the order of user interaction and how to provide
an intuitive guide to exploring the web page. The map implementation was simple
enough, but I wanted each of the three "sections" of the page to communicate
with each other. For example, a click on the map would load the data for that
district in the detailed profile. Meanwhile, we needed to keep track of the
last three clicked districts because they would be featured in the "compare
districts" section. The user could also interact directly with the compare
tool by selecting districts from the drop-downs.
I began the week with hard-coded data because we realized we really needed
to build a REST API to avoid reloading the page every time the user chose a
new school district. By the end of the week we had a link like:
http://school-discipline.herokuapp.com/api/districts/680
serving school district data for Orange County Schools (district 680).
Once the data was loading dynamically we realized two things:
1) sometimes ugly data in the wild breaks your beautiful user-interface, and
2) when you host your data with a free server...sometimes it takes a really
long time to load.
Week Four - Bug fixing and refining the mobile experience
We began the week with some definite problems to resolve, including writing
code to cover newly discovered edge cases in the data, and adding a visual
loading experience to let the user know that awesome things were happening
behind the scenes.
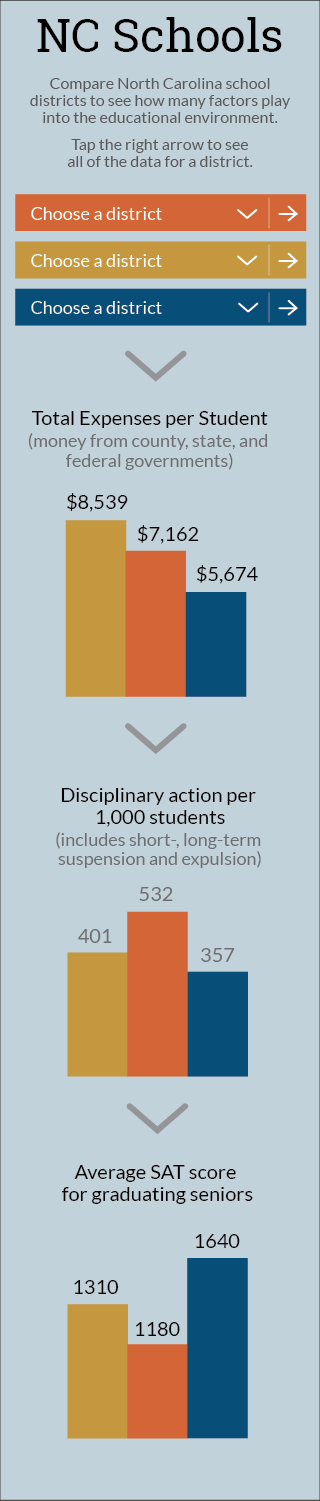
We also realized that the carefully designed order of exploration
was not intuitive on mobile. We needed to eliminate the map to provide a more compact view.
Since the map was no longer acting as the anchor and broad overview of the data,
we decided to take the user straight to the compare districts experience as an
overview and introduction. From there we offered the option to drill down into
a district's details (pages created for each district using a Django template).
See below for my full-color mocks or try it out yourself
on your smartphone or browser window smaller than 600 pixels wide!